This chapter introduces representations, in particular symbolic ones: how they are structured and how they describe things, including spatial ones. It explains that spatial symbolic representations are frequently graphs and presents some of the advantages of using such mathematical foundations. The chapter concludes with the paradigmatic and syntagmatic dimensions of representations, and their relevance for interpretation and management.
Symbolic representations
Many of the misunderstandings concerning information stem from our lack of understanding of representations and how these convey information. Representations are so central to our thinking that even if the sender of some information has failed to structure it in a representation, the receiver does so automatically. A representation can be succinctly defined as a system for describing a particular class of entities. The result of applying a representation to an entity is therefore a description. Representations of the symbolic kind, which proliferate human societies, consist of two main components:
- A usually finite set of symbols
- Some rules for linking these symbols to the entities they describe
The decimal numeral system is such a symbolic representation. Its symbols are the familiar Hindu-Arabic numerals:
SD = {0,1,2,3,4,5,6,7,8,9}
The rules by which these symbols are linked to the quantities they describe can be summarized as follows:
nn · 10n + nn-1 · 10n-1 + … + n1 · 101 + n0 · 100
These rules underlie positional notation, i.e. the description of a quantity as:
nnnn-1 …. n1n0
For example, the description of seventeen becomes:
1 · 101 + 7 · 100 ⇒ 17
The binary numeral system is essentially similar. Its symbol set consists of only two numerals and its rules employ two as a base instead of ten:
SB = {0,1}
nn · 2n + nn-1 · 2n-1 .+ … + n1 · 21 + n0 · 20
This means that seventeen becomes:
1 · 24 + 0 · 23 + 0 · 22 + 0 · 21 + 1 · 20 ⇒ 10001
There are often alternative representations for the same class of entities. Quantities, for example, can be represented by (from left to right) Roman, decimal and binary numerals, as well as one of many tally mark systems:
XVII = 17 = 10001 = IIII IIII IIII II
A representation makes explicit only certain aspects of the described entities. The above numerical representations concern quantity: they tell us, for example, that there are seventeen persons in a room. The length, weight, age or other features of these persons are not described. For these, one needs different representations.
Each representation has its advantages. Decimal numerals, for example, are considered appropriate for humans because we have ten fingers that can be used as an aid to calculations. Being built out of components with two states (on and off), computers are better suited to binary numerals. However, when it comes to counting ongoing results like people boarding a ship, tally marks are better suited to the task. Some representations may be not particularly good at anything: it has been suggested that despite their brilliance at geometry, ancient Greeks and Romans failed to develop other branches of mathematics to a similar level because they lacked helpful numeral representations.
Symbols and things
The correspondence between symbols in a representation and the entities they denote may be less than perfect. This applies even to the Latin alphabet, one of the most successful symbolic representations and a cornerstone of computerization. Using the compact set of symbols in an alphabet instead of syllabaries or logographies (i.e. graphemes that correspond to syllables or words) is an economical way of describing sounds (phonemes) in a language. This turns a computerized text into a string of ASCII characters that combine to form all possible words and sentences. Imagine how different text processing in the computer would be if its symbols were not alphabetic characters but pixels or lines like the strokes we make to form the characters in handwriting.
At the same time, the correspondence between Latin alphabet graphemes and the phonemes in the languages that employ them is not straightforward. In English, for example, the letter A may denote different phonemes:
- ɑ: (as in ‘car’)
- æ (as in ‘cat’)
- ɒ (as in ‘call’)
- ə (as in ‘alive’)
- ɔ: (as in ‘talk’)
The digraph TH can be either:
- θ (as in ‘think’) or
- ð (as in ‘this’)
Conversely, the phoneme eɪ can be written either as:
- AY (as in ‘say’)
- EI (as in ‘eight’)
The lesson we learn from these examples is that abstraction and context are important in representation. Abstraction allows for less strict yet still clear relations between symbols and things, as with the letter A which represents only vowels. A one-to-many correspondence like that is trickier than a simple one-to-one relation but is usually clarified thanks to the context, in our case proximal alphabetic symbols: ‘car’ and ‘cat’ are very similar strings but most English learners soon learn that they are pronounced differently and associate the right phoneme with the word rather than the letter. Similarly, in the floor plan of a building one soon learns to distinguish between two closely spaced lines denoting a wall and two very similar lines representing a step (Figure 1).

Spatial symbolic representations
Symbolic representations are also used for spatial entities. A familiar example are metro and similar public transport maps. A common characteristic of many such maps is that they started life as lines drawn on a city map to indicate the route of each metro line and the position of the stations (Figure 2). As the size and complexity of the transport networks increased, the metro lines and stations were liberated from the city maps and became separate, diagrammatic maps: spatial symbolic representations, comprising symbols for stations and connections between stations (Figure 3). The symbols are similar for each line but may be differentiated e.g. by means of shape or colour, so that one can distinguish between lines. The symbol set for a metro network comprising two lines (the red O line and the blue Plus line) would therefore consist of the station symbol for the red line, the station symbol for the blue line, the connection symbol for the red line and the connection symbol for the blue line:
SM = {o, +, |o, |+ }
The rules that connect these symbols to real-world entities can be summarized as follows:
- Each station on a metro line (regardless of the complexity of the building that accommodates it) is represented by a station symbol of that line
- Each part of the rail network that connects two stations of the same line is represented by a line symbol of that line
These common-sense, practical principles underlie many intuitive attempts at spatial representation and, as discussed later on, even a branch of mathematics that provides quite useful and powerful means for formalizing and analysing symbolic spatial representations.


Our familiarity with metro maps is to a large degree due to their legibility and usability, which make them excellent illustrations of the strengths of a good representation. As descriptions of a city transport system, they allow for easy and clear planning of travels, facilitate recognition of interchanges and connections, and generally provide a clear overview and support easy understanding. To manage all that, metro maps tend to be abstract and diagrammatic (as in Figure 2), in particular by simplifying the geometry of the metro lines (usually turning them into straight lines) and normalizing distances between stations (often on the basis of a grid). As a consequence, metro diagrams are inappropriate for measuring geometric distances between stations. Still, as travelling times on a metro often depend mostly on the number of stations to be traversed, metro maps are quite useful for estimating the time a trip may take. However, for finding the precise location of a station, city maps are far more useful.
A comparison of metro maps to numerals leads to the suggestion that the increase in dimensionality necessitates explicit representation of relations between symbols. In the one-dimensional numerals, relations are implicit yet unambiguous: positional notation establishes a strict order that makes evident which numeral stands for hundreds in a decimal number and how it relates to the numerals denoting thousands and tens. Similarly, in another kind of one-dimensional representation, spaces and punctuation marks are used in alphabetic texts to indicate the clustering of letters into words, sentences and paragraphs, and thus facilitate understanding of not only phonemes but also meanings in the text.
In two-dimensional representations like the metro diagrams, proximity between two station symbols does not suffice for inferring the precise relation between them. One needs an explicit indication like a line that connects the two symbols. A metro map missing such a connection (Figure 4) is puzzling and ambiguous: does the missing connection mean that a metro line is still under development or simply that the drawings is incomplete by mistake? Interestingly, such an omission in a metro diagram is quite striking and does not normally go unnoticed, triggering questions and interpretations, which will be discussed in the chapter on information theory (in relation to anti-data).

Similarly puzzling is a metro map where stations of different lines are close to each other, even touching (Figure 5): does this indicate that the stations are housed in the same building, so that one can change from one line to the other, or that the stations are close by but separate, in which case one has to exit the metro and enter it again (which may involve having to buy a new ticket)? In a metro map where stations are clearly connected or coincide (Figure 3), there is no such ambiguity concerning interchange possibilities.

Graphs
Diagrams like these metro maps are graphs: mathematical structures that describe pairwise relations between things. Graph theory in mathematics began in 1736 with Euler’s study of paths that crossed the bridges of Königsberg only once and has since gone from strength to strength. A key element of their success is that graphs are fairly simple but strictly structured diagrams consisting of vertices (or nodes) and edges (or lines) that link pairs of vertices. Vertices usually denote things and edges relations. In Figure 3, each metro station is a vertex and each connection between two stations an edge.
Graphs have a wide range of applications, from computer networks and molecular structures to the organization of a company or a family tree. The tools supplied by graph theory help analyse and quantify many of aspects of such networks. For example, the degree of a vertex (the number of edges connected to it) is a good indication of complexity: in a metro map it indicates the number of lines that connect there. The degree can therefore be used to identify interchanges, as well as a basic measure of how busy each interchange might be. Another measure is the closeness of a vertex: its mean distance to all other vertices in the graph (distance being the number of edges in the shortest path between two vertices). Closeness is a good indication of a vertice’s centrality in a graph.
The degree sequence of a graph is a sequence that is obtained by listing the degrees of its vertices. In a map of a metro line this sequence is a good expression not only of opportunities for crossing over to other lines but also an indication of how busy the line may become as passengers make use of such opportunities. One can measure complexity in the whole graph in other ways, too, e.g. through eccentricity: the greatest distance between a vertex and any other vertex in the graph. The eccentricity of a metro station relates to its remoteness or poor connectivity. The diameter of the graph is the greatest eccentricity of any vertex in it and its radius the smallest eccentricity of any vertex. Vertices with an eccentricity equal to the radius are the center of the graph, while those with an eccentricity equal to the diameter are the periphery, In a metro system, therefore, it is interesting to know how many stations form te center and should consequently be easily and quickly accessible, and how many are in the periphery.
Finally, in order to be able to travel on the metro, the graph has to be connected: each vertex should connect to every other vertex by some sequence of edges and vertices (the graph in Figure 5 is therefore not connected). In fact, this sequence should be a path: no vertex should occur twice. Any edge that divides a graph into two parts (as in Figure 4) is called a bridge. In our metro example, all edges are bridges, making the metro particularly sensitive: any problem between two stations can render it unusable, as passengers cannot move along alternative routes.
What the above examples illustrate is that a well-structured representation can rely on mathematical tools that help formalize its structure and analyses. This is important for two reasons: firstly, formalization makes explicit what one may recognize intuitively in a representation; secondly, it allows for automation, especially of analyses. Allowing computers to perform painstaking and exhaustive analyses complements, liberates and supports the creative capacities of humans.
Graphs and buildings
Graph-like representations are also used for buildings: architects, for example, use bubble and relationship diagrams to express schematically the spatial structure of a design (Figure 3). In such diagrams nodes usually denote spaces where some specific activities take place (e.g. “Expositions” or “Library”), while edges or overlaps indicate proximity or direct access.

On the basis of graph theory, more formal versions of such diagrams have been developed, such as access graphs.Here nodes represent spaces and edges openings like doors, which afford direct connection between spaces. Access graphs are particularly useful for analysing circulation in a building.[1]

The access graph demonstrates the significance of explicit structure: pictorially it may have few advantages over relationship diagrams, as both make explicit the entities in a representation and their relations. However, imposing the stricter principles of a mathematical structure reduces vagueness and provides access to useful mathematical tools. In a relationship diagram one may use both edges and overlaps to indicate relations, and shapes, colours and sizes to indicate properties of the nodes. In a graph, one must use only nodes and edges, and label them with the necessary attributes. This improves consistency and clarity in representation, similarly to the standardization of spelling in a language. It also facilitates application of mathematical measures which give clear indications of design performance. For example, the eccentricity of the node representing the space from where one may exit a building is a useful measure of how long it may take for people to leave the building, which is critical for e.g. fire egress. Similarly, the significance of a space for pedestrian circulation is indicated by its degree in the access graph, while spaces that form bridges are opportune locations for circulation control. For all these reasons, graphs are a representational basis to which we will returning in several parts of this book.
Paradigmatic and syntagmatic dimensions
In a symbolic representation we can analyse descriptions along two dimensions: the paradigmatic and the syntagmatic.[2] The paradigmatic dimension concerns the symbols in the representation, e.g. letters in a text. The syntagmatic dimension refers to the sequence by which these symbols are entered in the description. The meaning of the description relies primarily on the paradigmatic dimension: the symbols and their arrangement in the description. Syntagmatic aspects may influence the form of these symbols and their arrangement but above all reveal much about the cognitive and social processes behind the representation and its application, as well as mechanical aspects. For instance, in a culture where left-to-right writing is dominant, one would expect people to write numerals from left to right, too. However, the Dutch language uses a ten-before-unit structure for number words between 21 and 99 (as opposed to the unit-and-ten structure in English), e.g. “vijfentwintig” (five-and-twenty). Consequently, when writing by hand, e.g. noting down a telephone number dictated by someone else, one often sees Dutch people first enter the ten numeral, leaving space for the unit, and then backtrack to that space to enter the unit numeral. With a computer keyboard such backtracking is not possible, so the writer normally pauses while listening to the ten numeral, waits for the unit numeral and then enters them in the reverse order. Matching the oral representation to the written one may involve such syntagmatic peculiarities, which are moreover constrained by the implementation means of the representation (writing by hand or typing).
In drawing by hand, one may use a variety of guidelines, including perspective, grid and frame lines, which prescribe directions, relations and boundaries. These lines are normally entered first in the drawing, either during the initial setup or when the need for guidance emerges. The graphic elements of the building representation are entered afterwards, often in direct reference to the guidelines: if a graphic element has to terminate on a guideline, one may draw it from the guideline or, if one starts from the opposite direction, slow down while approaching the guideline, so as to ensure clear termination. Similar constraining influences may also derive from already existing graphic elements in the drawing: consciously or unconsciously one might keep new graphic elements parallel, similarly sized or proportioned as previously entered ones, terminate them against existing lines etc. Such mechanical and proportional dependence on existing graphic elements has led to the development of a wide range of object-snap options and alignment facilities in computerized drawing.
Any analysis of the paradigmatic dimension in a description aims at identifying symbols, e.g. relating each stroke in a handwritten text to a letter. To do that, one has to account for every stroke with respect to not only all symbols available in the representation but also various alternatives and variations, such as different styles of handwriting. Analyses of the syntagmatic dimension have to take into account not only the paradigmatic dimension (especially symbols and implementation mechanisms) but also cognitive, social, mechanical aspects that may have played a role in the temporal process of making a description, such as the tendency to draw from an existing graphic element to endure clear termination. Similarly, in most BIM editors, one enters openings like doors or windows only after the walls that host them have been entered in the model, while rooms are defined only after the bounding walls have been completed.
As all that relates to the organization of a design project and the relations between members of a design team, the syntagmatic dimension is of particular relevance to the management of information processes. Thankfully, there are sufficient tools for registering changes in a digital representation, since adding a time stamp to the creation, modification and eventual deletion of a symbol in a computer program is easy and computationally inexpensive. Making sense of what these changes mean requires thorough analysis of the sequences registered and clear distinctions between possible reasons for doing things in a particular order.
The significance of the syntagmatic dimension increases with the dimensionality of the representation: in a one-dimensional representation like a text, the sequence by which letters are entered is quite predictable, including peculiarities like the way Dutch words for numbers between 21 and 99 are structured. In representations with two or more dimensions, one may enter symbols in a variety of ways, starting from what is important or opportune and moving iteratively through the description until it is complete (although completeness may be difficult to ascertain syntagmatically, making it unclear when the process should terminate). This clearly indicates the significance of the syntagmatic dimension for the management of 3D and 4D representations of buildings.
Key Takeaways
- Symbolic representations employ usually finite sets of symbols and rules to relate these symbols to specific classes of entities and produce descriptions of these entities
- Familiar spatial symbolic representations like metro diagrams are graphs: mathematical structures that describe pairwise relations between things, using nodes for the things and edges for the relations
- Graphs are a useful representational basis for buildings because they make symbols and relations between symbols explicit and manageable
- Symbolic descriptions have a paradigmatic and a syntagmatic dimension, relating respectively to the symbols they contain and the sequence by which the symbols have been entered in the description
- Interpretation of a description relies primarily on the paradigmatic dimension, while management strongly relates to the syntagmatic dimension
Exercises

- Draw graphs for the above post-and-beam structure:
- One using vertices for the posts and beams and edges for their connections
- One using vertices for the junctions and edges for the posts and beams
- Calculate the following for the above graphs:
- The degree and eccentricity of each vertex
- The diameter and radius of each graph
- Draw an access graph for the following floor plan:
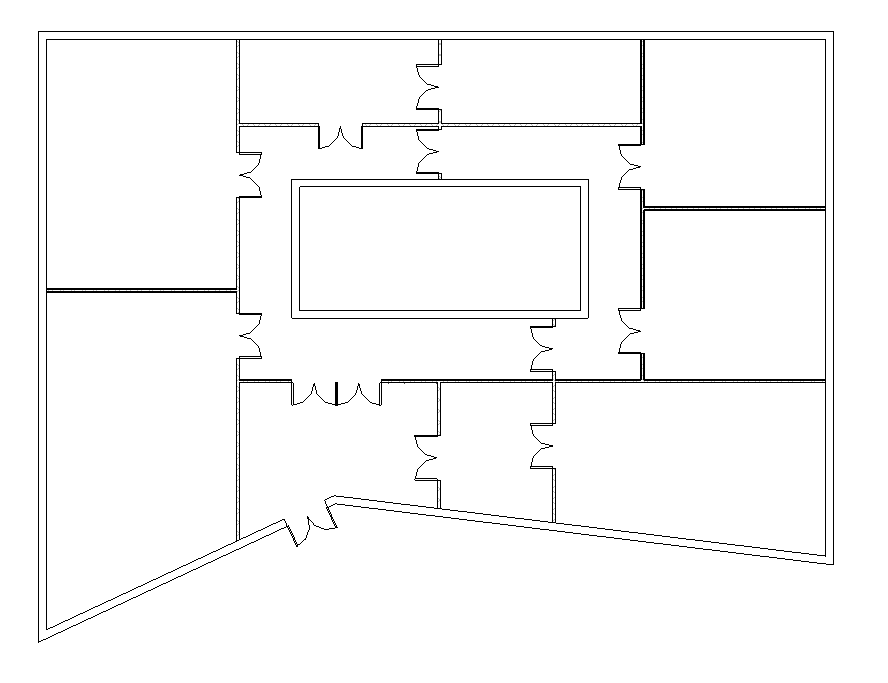
- In the access graph:
- Calculate the degree and eccentricity of each vertex
- Calculate the diameter and radius of the graph
- Indicate the vertices belonging to the center and the periphery
- Identify any bridges in the access graph

- Graph-based applications in the representation of buildings are discussed extensively in: Steadman, P., 1983. Architectural morphology: an introduction to the geometry of building plans. London: Pion. ↵
- The discussion on the paradigmatic and syntagmatic dimensions in visual representations draws from: Van Sommers, P., 1984. Drawing and cognition: descriptive and experimental studies of graphic production processes. Cambridge: Cambridge University Press. ↵
