This chapter describes how process and information diagrams can describe tasks in a process and the information actions relating to these tasks in a comprehensive and coherent manner.
Flow charts
As we have seen in the previous chapter, there is some correspondence between the sequence of tasks in a process and the sequence of information actions: process management and IM overlap. The main difference is that IM goes beyond the actions and transactions in a task, in order to identify, structure and connect information in a way that supports and anticipates the needs of the process. Therefore, the first step towards effective IM in any process is understanding the process itself: what people actually do and how their actions, decisions, interactions and transactions relate to the production, dissemination and utilization of information. Starting IM by analysing the process also has advantages for the deployment of IM measures: most people and organizations are more process-oriented than information-oriented and may have difficulty identifying and organizing information actions without a clear operational context. Using a process model as background makes clearer why and how one should manage information.
A process can be described as a sequence of tasks towards a specific outcome. Representing processes diagrammatically is particularly useful in our case because of the abstraction and consistency afforded by diagrams. Of the many kinds of diagrams available for this purpose, basic flow charts suffice in practically all cases. These diagrams are directed graphs, in which objects are represented by nodes of various kinds corresponding to different kinds of objects, while relations are described by arcs (Figure 1). The direction of the arcs indicates the direction of flow in the process. Bidirectional arcs should be avoided because they usually obscure separate tasks, e.g. evaluation followed by feedback. Explicit representation of such tasks is essential for both the process and IM.
To make an unambiguous and useful flow chart of a process, one should adhere to another basic rule: that each object should appear only once as a node in the diagram. This allows us to make feedback explicit and to measure the degree of a node, its closeness and all other graph-theoretic measures that can be used in analysing the process.
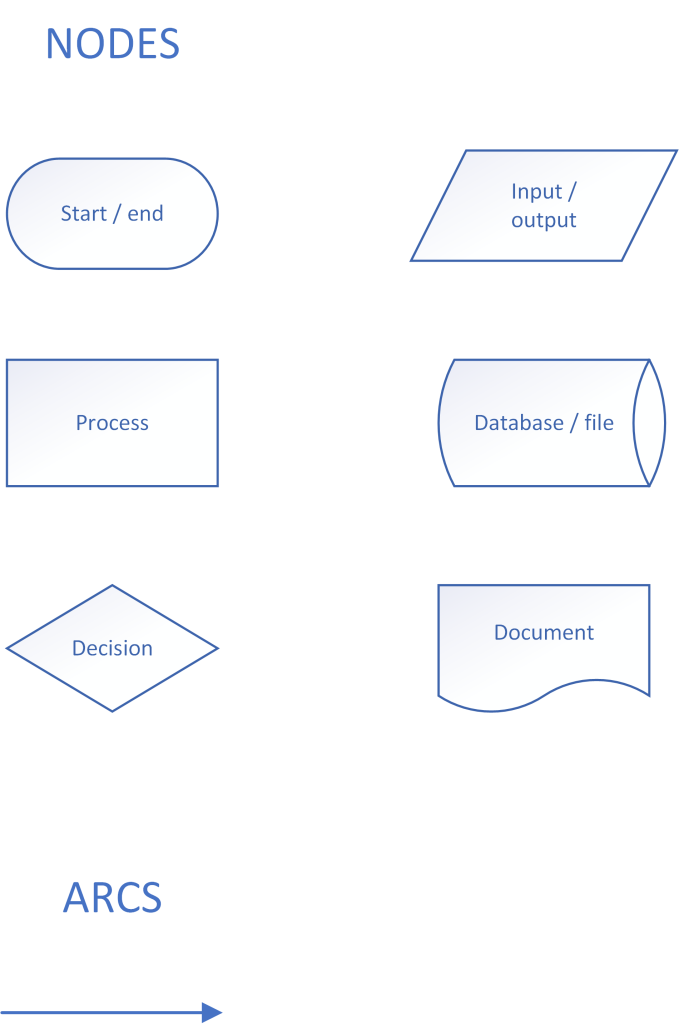
Process diagram
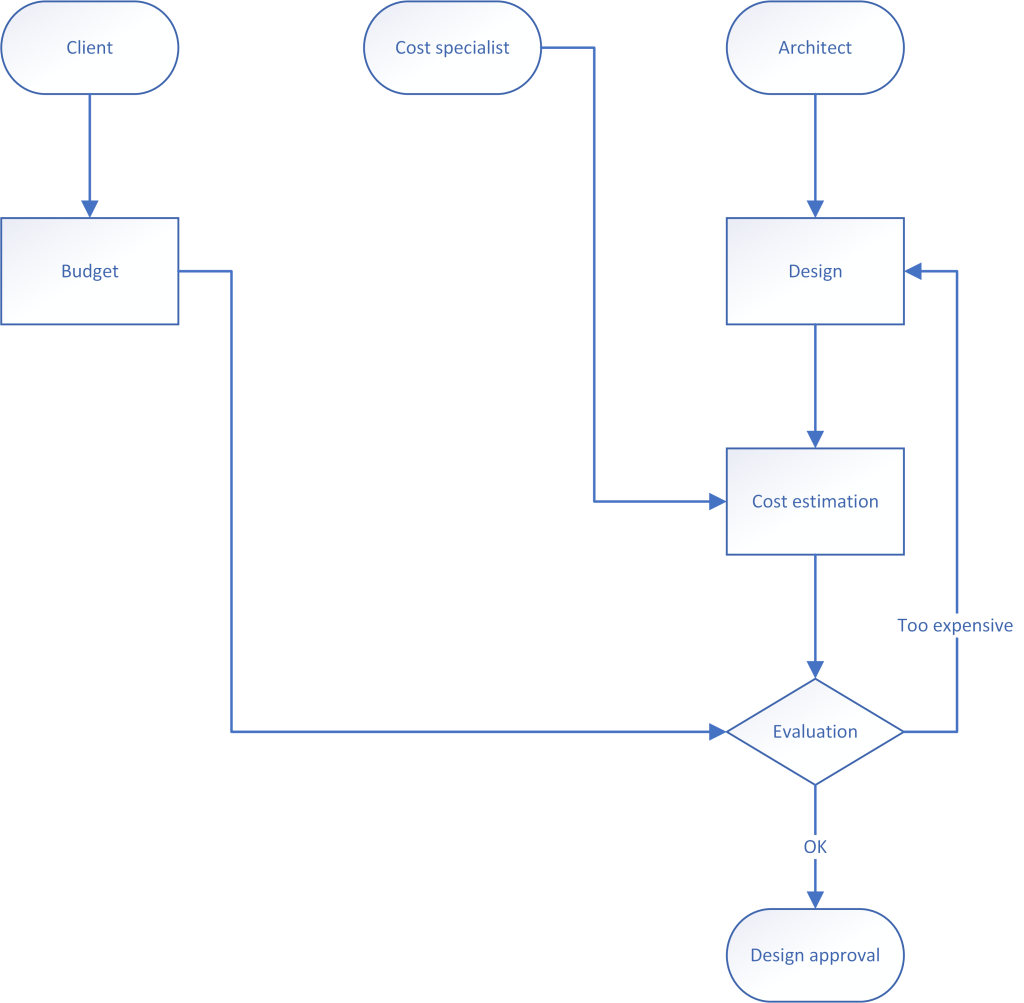
Let us consider a simple example of a process in building design: the estimation of construction cost in early design, on the basis of gross floor area. The process involves three actors: the client, the architect and the cost specialist. These are responsible for the budget, the design, the cost estimation and the evaluation of the estimate, which leads to either feedback to the design (usually to lower the cost) or acceptance of the design as it is (Figure 2).
Information diagram
The process diagram is clear about who does what but the actual information they produce and consume remains obscure. This generic depiction may be useful for process management but is too abstract for IM. Using the process diagram as a foundation, one can develop an information diagram that makes information and its flow explicit (Figure 3). Actor nodes may be abstracted from an information diagram in order to focus on the analysis of process-related and data-related nodes into information instances. Ultimately, however, in IM one should always identify who does what in unambiguous terms.
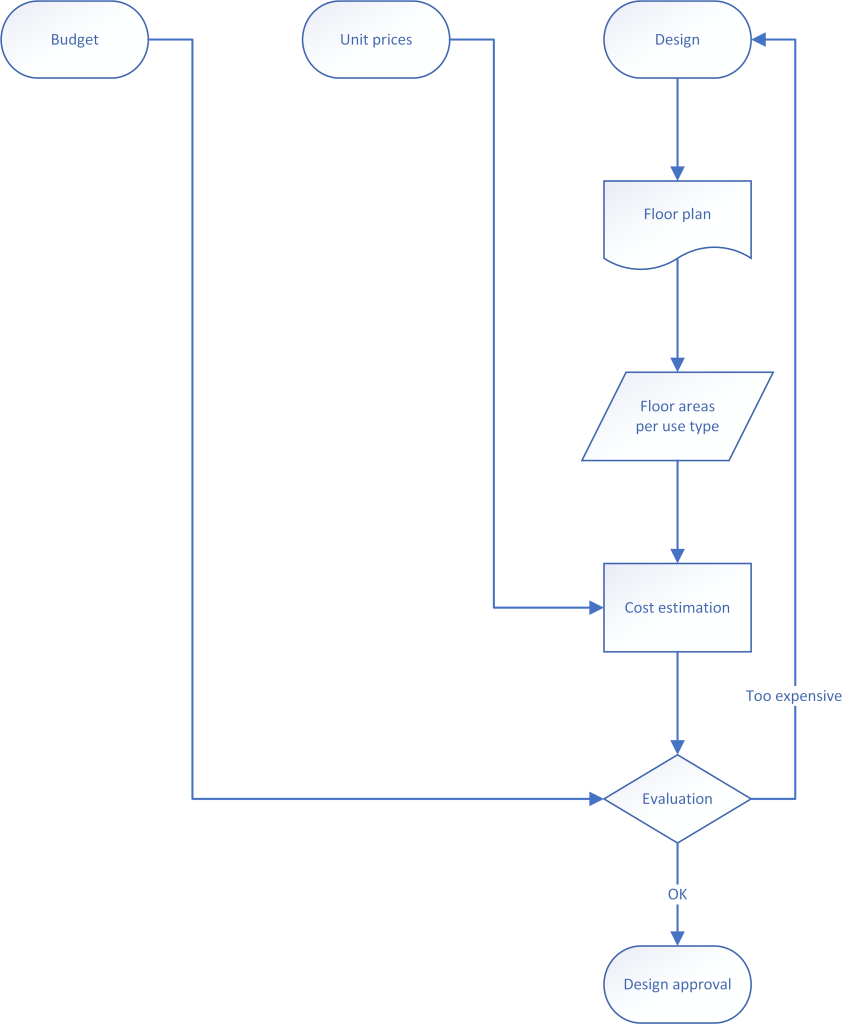
In this diagram, too, each object should appear only once, as a single node. So, if the floor plan has to be redrawn because the design is deemed too expensive, the diagram should contain feedback loops to the floor plan of the same (albeit modified) design, so as to make the process cycles explicit. If the cost evaluation leads to a radically new design, requiring a new node in the diagram, then this should be made clear by means of unambiguous node labelling (e.g. Design 1 and Design 2). Such new versions of the same nodes should be used cautiously and sparingly, only when absolutely necessary, e.g. when a process involves design alternatives.
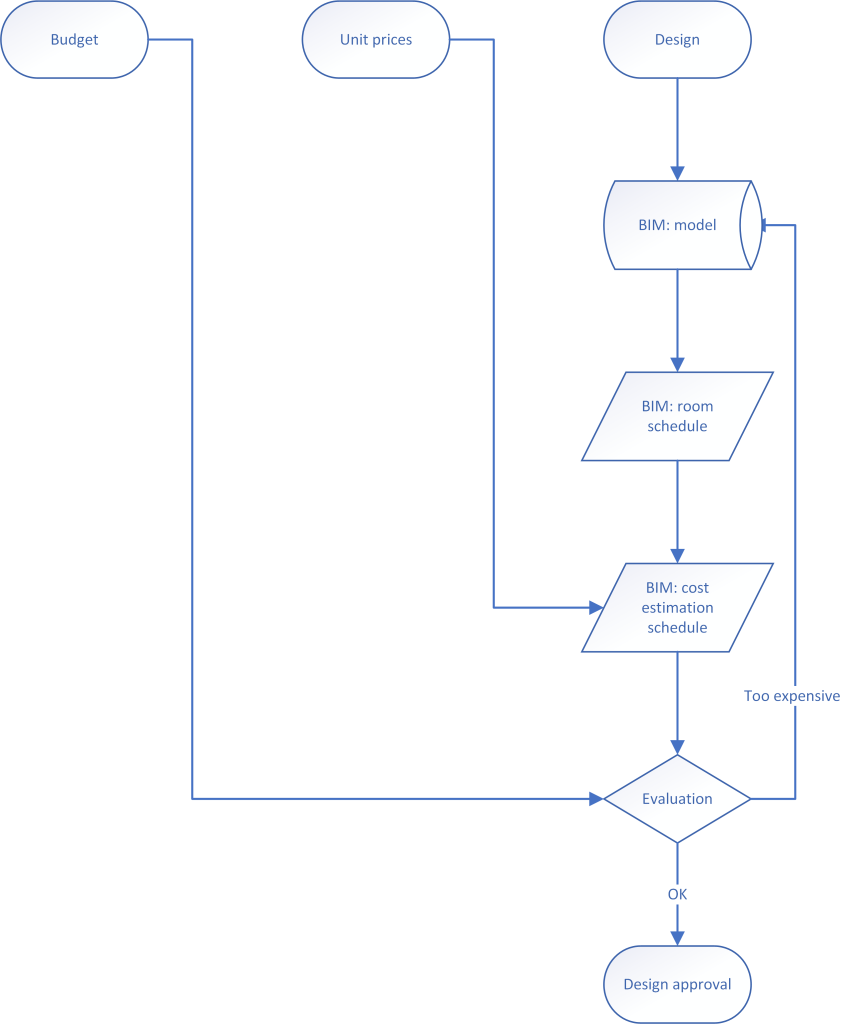
The information diagram should reveal what actually takes place in terms of input, processing and output in the process. For example, a cost specialist contributes to the cost estimation by supplying a list of unit prices, i.e. cost of gross floor area per m2 for different categories of building use. One m2 of storage area costs significantly less than one m2 of office space, which in turn costs less than one m2 of an operating theatre in a hospital. This also means that one has to extract matching data from the design. It is not enough to calculate the total gross floor area of a hospital design; one has to know the use of every space, so as to be able to calculate the subtotals for each category. The subtotals are then multiplied by the unit prices to arrive at a correct estimate and ascertain which category may be too big or too costly.
The above illustrates an important difference between process and information diagrams: the former can be abstract about what each task entails but the latter has to be specific regarding information sources (e.g. which drawings are used), the information instances these sources accommodate and the actions through which these instances are processed. The higher specificity of the information diagram leads to a finer grain in the analysis of the process into nodes and arcs that allow one to trace the flow of information instances. In general, it may be assumed that the flow is the same in both diagrams but the finer grain of the information diagram may lead to new insights and local elaborations or changes.
I‑P‑O and primary versus derivative
Transforming a process diagram into an information diagram involves the I‑P‑O scheme. Examining each node in the process diagram with respect to this scheme reveals which information is used as input and produced as output. The Design node, for example, is expected to contribute to a cost estimation involving gross floor areas. This means that the design cannot exist solely in the architect’s mind; we need some external representation as input, on the basis of which we can measure floor areas, moreover by use category. The obvious candidate is a floor plan and, more precisely, one where all spaces are indicated and labelled by their use. This floor plan rather than some abstract notion of a design is the appropriate input for the processing we require (calculation of gross floor areas). In the same manner, one can establish that these areas are the local output of a task: what has to be passed on to the next processing step (cost estimation) as input.
Equally important for the development of a complete and specific information diagram is the semantic type of information used as input: if it is derivative, one has to trace it back to the primary data from which it is produced. Floor areas are derivative, so one needs to identify the primary data from which they derive, as well as the representations that accommodate these primary data. Consequently, one should not just require a table of all spaces, their areas and use type from the design but also specify that for making this table one needs floor plans that describe the spaces and their uses. These floor plans should be present as sources in the information diagram.
Information diagrams for BIM
As explained in previous chapters, implementation mechanisms may affect the structure and use of a representation in non-trivial ways. Consequently, one should take implementation environments into account in an information diagram, including adapting the diagram following any change in implementation environment: what applies to analogue information processes may be significantly different to what should take place in a computer.
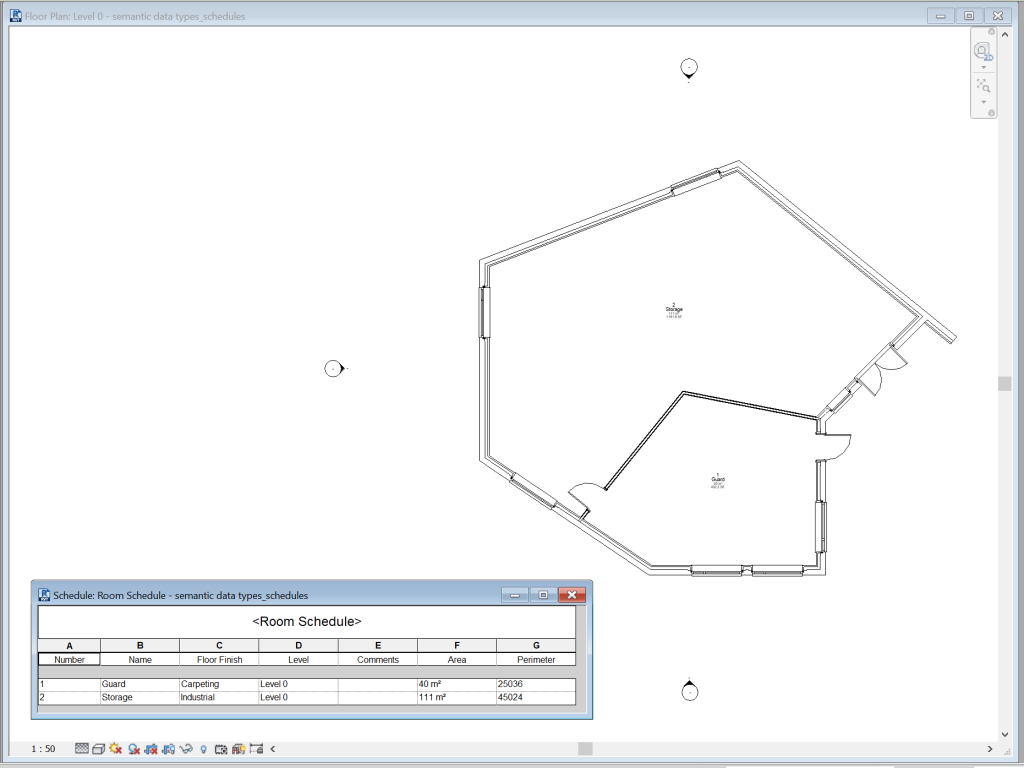
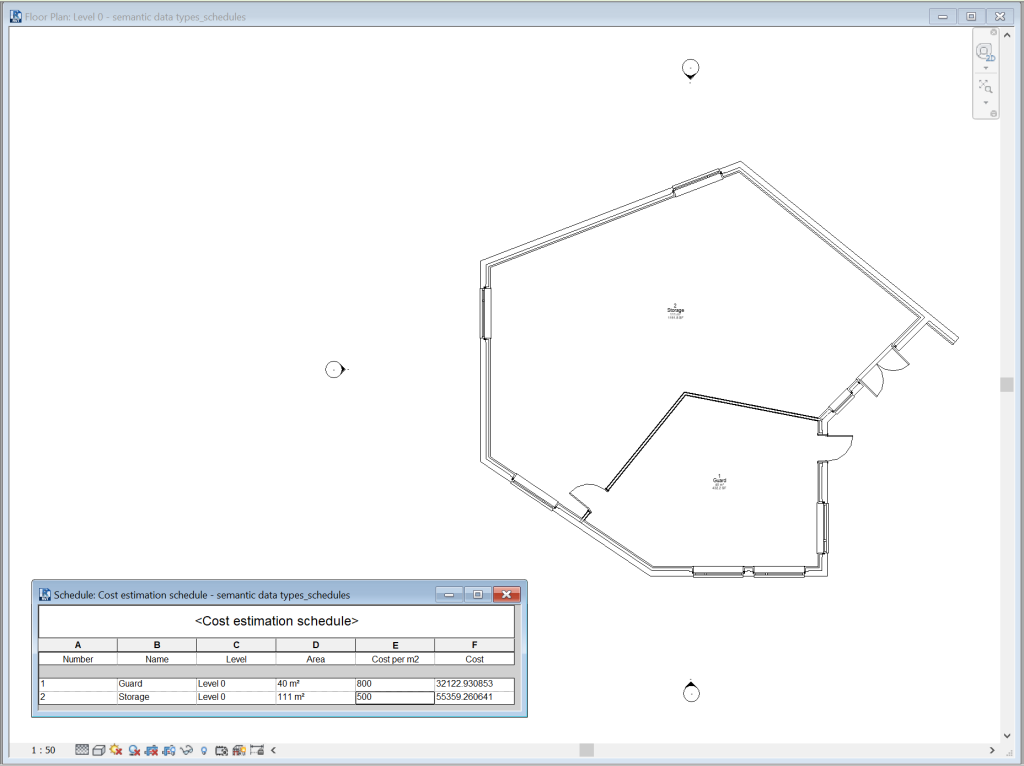
The information diagram we have considered so far for cost estimation could be called generic, although it primarily reflects analogue practices and media. Adapting it to BIM means first of all that the model (the central information system) should be explicitly present as a source. This information system contains the symbols and relations in which primary data are found. Derivative data like floor area calculations are produced from the model in views like schedules. These schedules are typically predefined in various formats, including room schedules that list spaces and their properties, including floor area calculations (Figure 4). They can be used to verify that the model contains all the primary data needed for the cost estimation.
Unit prices can be added to room schedules, thus integrating cost estimation in BIM in a straightforward and transparent manner (Figure 5).
Integrating cost estimation in BIM also means that feedback to the model should be similarly direct and straightforward, e.g. through annotations to spaces, especially large or expensive ones that should be prioritized when improving the design to match the constraints of the budget (Figure 6). Note that feedback in this example is abstract with regard to the particular symbols or relations that are affected. One may choose to be quite specific about this, so as to guide information actions with precision and certainty. Reversely, if one chooses abstract actions, then this would involve interpretation by certain actors. These actors should therefore be explicit in the diagram as authors or custodians of specific information .
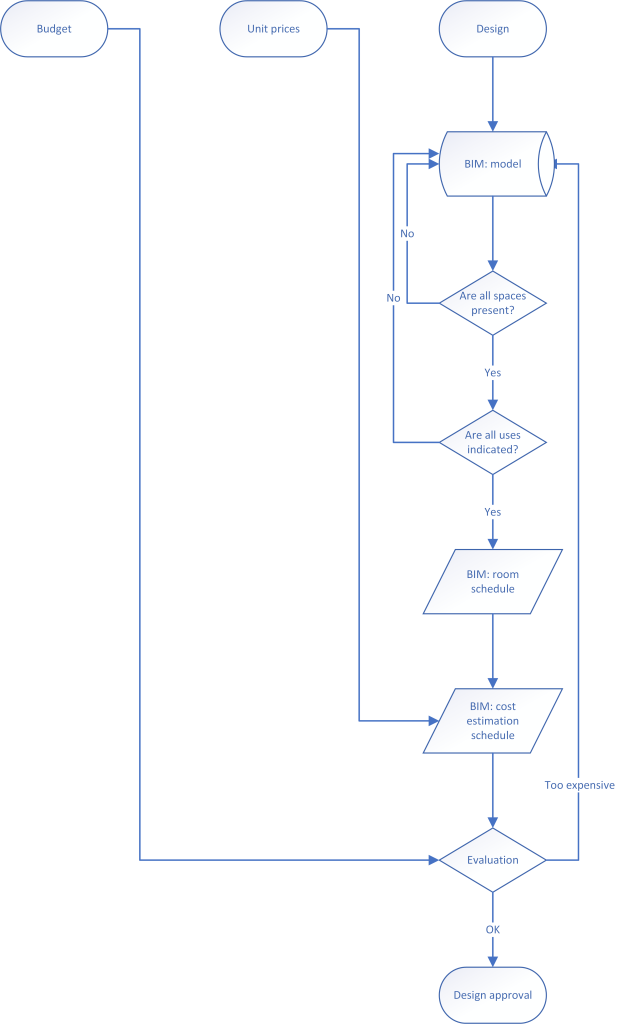
An integrated information environment like BIM also makes automation of various information controls possible, e.g. concerning the presence of essential primary data. These too can be included in an information diagram for BIM (Figure 7).
Using information diagrams in information management
An information diagram that captures both the needs of a process and the capacities of BIM can make IM clear and unambiguous to both managers and actors in the process. Information flow can be explicitly depicted in the diagram, especially concerning what, who and when. Managers can use the information diagram to guide and control the process at any moment, while actors have a clear picture of the scope and significance of their actions. Addressing how questions depends on the fineness of the grain in the description of information instances: the finer it is, the more specific answers one can draw from the diagram. As such specificity affects interpretation, one should be careful about the balance between the two: many actors in a building project are knowledgeable professionals who may not take kindly to IM approaches that overconstrain them.
On the other hand, IM has to be strict about matters of authorship and custodianship because not everybody is yet accustomed to the possibilities and responsibilities of digital information processing. By linking actors to information with accordingly labelled arcs in the information diagram, one can indicate responsibilities and actions throughout a process. Note that roles can be variable: an actor who authors some information in one task may become custodian of other information in another task.
Concerning information quality, the information diagram forms a usable background for pragmatic value: applying the I‑P‑O scheme at any node is a critical part of measuring pragmatic value, i.e. establishing what users need to process and must produce in a task. Similarly, the information diagram is essential for the evaluation of completeness, coherence and consistency: it reveals the moments when one should return to the representation and analyse it. Such moments occur after critical information instances or after a multitude of information instances, i.e. when the model changes substantially.
The information diagram is also a necessity for our parsimonious approach to information value. This approach focuses on primary data and their propagation; both can be traced with accuracy in the diagram, including explicit, manageable connections to derivative data, enabling managers and users to know what should be preserved or prioritized. Finally, in the same manner one can identify anti-data, on the basis of expectations (e.g. knowing when information from different disciplines comes together in a process) and interpretation (e.g. that a space without a door is a shaft). This leads to directed action (e.g. requiring that two disciplines work together to solve interfacing problems), which should be present in an information diagram of appropriate specificity.
Key Takeaways
- Flow charts are directed graphs that can be used to describe a sequence of tasks (process diagram) or a sequence of information actions (information diagram).
- In both process and information diagrams, each object should be represented by only one node and each arc should be unidirectional.
- The I‑P‑O scheme helps translate a process diagram into an information diagram.
- Tracking the primary data needed for a process makes the information diagram complete and specific.
- Information diagrams should take into account the implementation environment of BIM: the symbols and relations that contain the primary data and the views that present derivative data, as well as the possibilities for quality control.
- Information diagrams make flows explicit and manageable; they also support analyses of information quality by identifying significant actions and moments.
Exercises
- Measure the degree and eccentricity of nodes, and the
eccentricity,diameter and radius of the graph in the process diagram of Figure 2. Do these measurements suggest critical parts in the process? - Measure the same in the information diagram of Figure 3. Do you observe any differences with Figure 2, also in terms of critical parts?
- Add symbols, properties and relations to the information diagram of Figure 7. Does the increased specificity make IM easier or more reliable?
- Add actors to the information diagram of Figure 7. How does the result compare to the diagram of the previous exercise?
